Experience the perfect balance of performance and price with the new Mimosa C6x Lite Edition — built for today, ready for tomorrow.

Merry Christmas and Happy Holidays everyone! The purpose of this blog post is to highlight some of the things we have designed, created, and tested extensively for the Mimosa Cloud.
That’s right! We have tweleve new features for you and we’re giving them to you as a Christmas present from us here at Mimosa! The Mimosa Cloud is a very important part of troubleshooting and monitoring Mimosa links. From my days at a WISP up until this very moment, the cloud has been instrumental in pointing me in the right direction during troubleshooting sessions. It is my hope that these new features will help you as much as they’ve helped me.
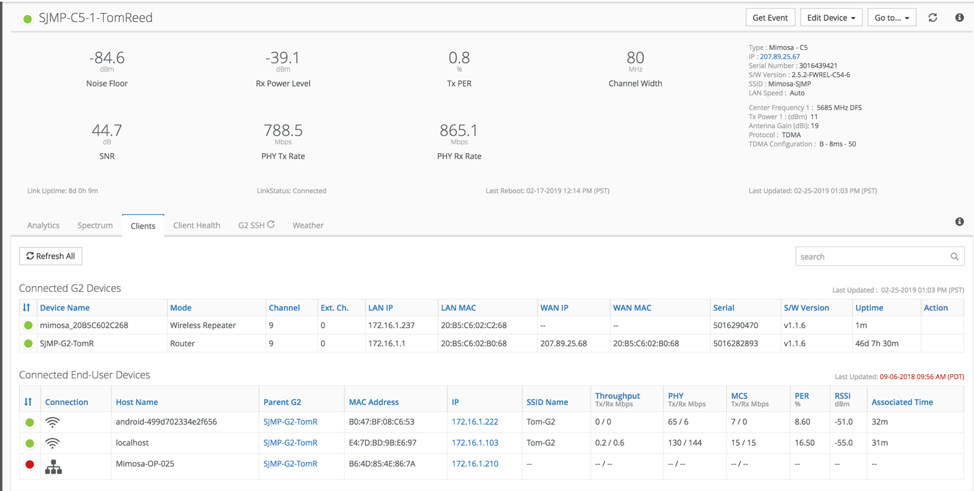
The first feature is all about the G2. This feature gives you a look into a customer’s network so you can see all connected devices. This will help you determine if someone’s complaint about slow speeds is due to their signal strength within the home or something else. The information available is current throughput, PHY rates, MCS rates, packet error rates (PER), RSSI per device, and association time. Our hope is that this feature will help you reduce truck rolls and help the customer troubleshoot in-home connectivity.
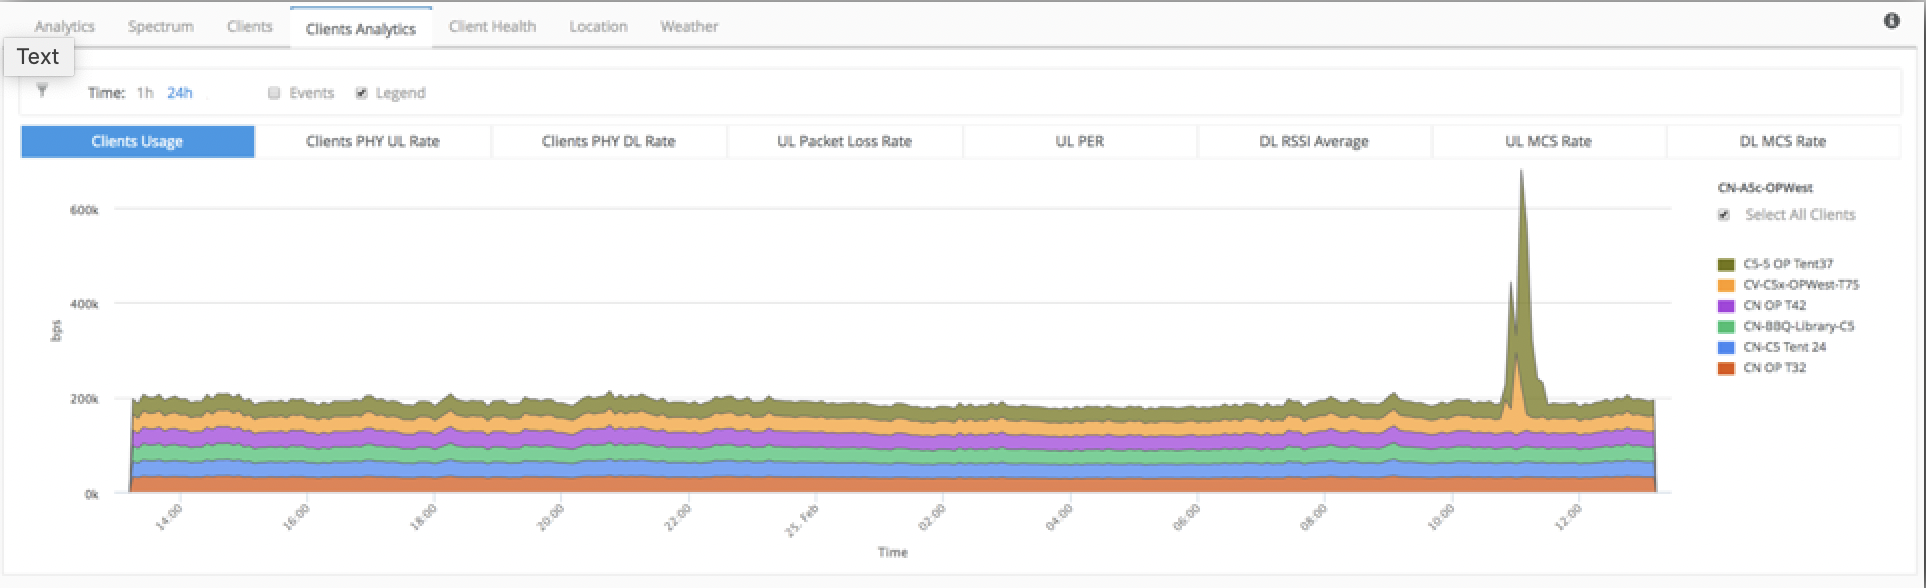
The next feature on the list is in-depth client analytics for your client radios. This feature includes Client Usage which shows you bandwidth usage per client radio connected to your access point. Personally, I’ve used this more than once to fish out bandwidth hogs on an access point. Client Analytics also includes Client PHY Rates for both Uplink and Downlink, Downlink RSSI, and Uplink and Downlink MCS rates. The best part about the rest of these features is that you can troubleshoot a particular customer or look for trends between customers. If you see a customer with low RSSI, you can compare that to others on the AP to see if you have an AP wide issue or just a customer issue.
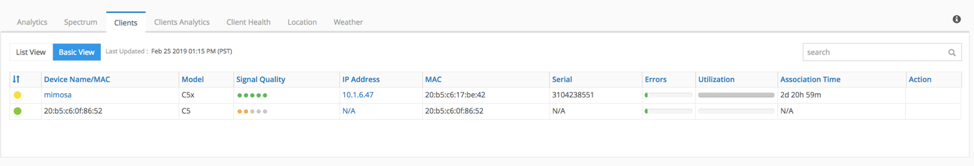
The Basic Client View provides you with a summary of info on the connected clients to the Access Point. This is similar to what you would see in the A5 GUI on the Clients tab. We can see what the name of the device is, which I hope you’re naming your C5s with unique names…, the model of the device, the overall signal quality, IP address, MAC address, serial number, error rates, utilization, and association time. It’s nice to have a quick view of your clients to see if any of them are suffering from errors or have low signal quality!
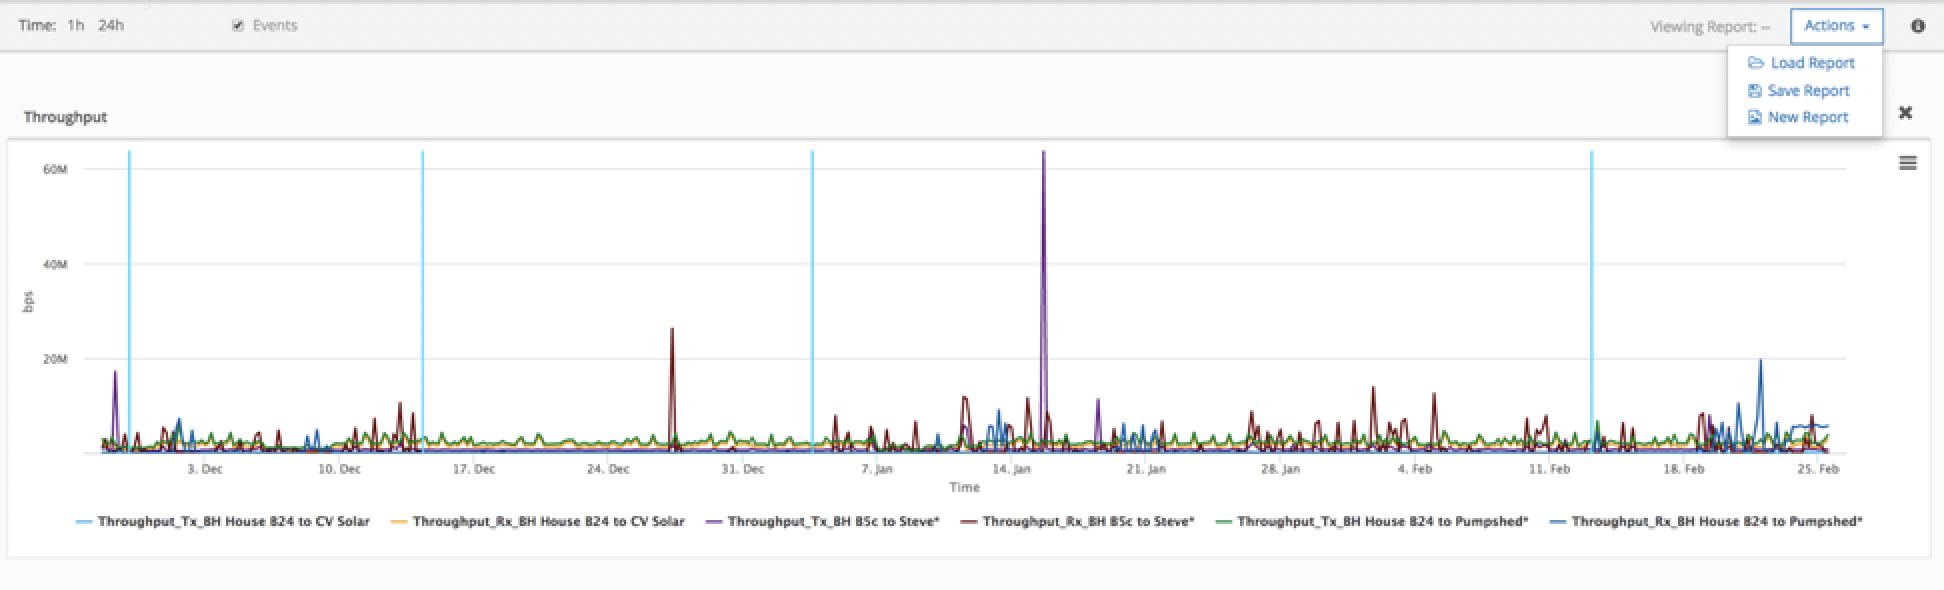
The Reports feature is a customizable graphing tool that is able to do device-centric graphing between two devices or series-centric graphs of up to ten devices. This can be used to compare how two, side-by-side links are performing or how multiple radios in an area are performing. What you want to graph and compare is up to you!
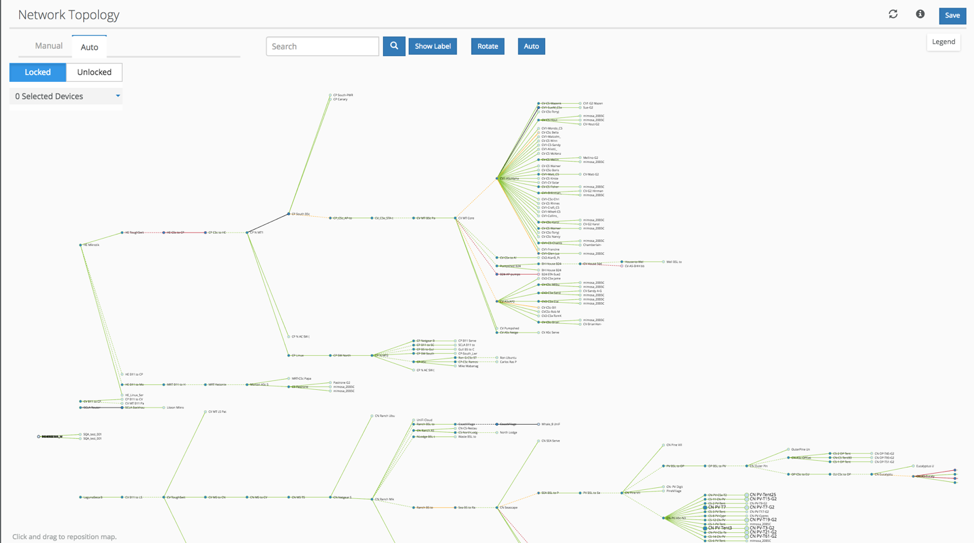
Did you know the Mimosa Cloud has a topology option when looking at your cloud-connected devices? A lot of people I’ve talked to have never used this feature because they have to manually move radio links around to try and networking tree that makes sense to them. Now you have the option to do Auto which arranges it for you in order of how your network is connected. This is just another way to view your network and watch for network outages.
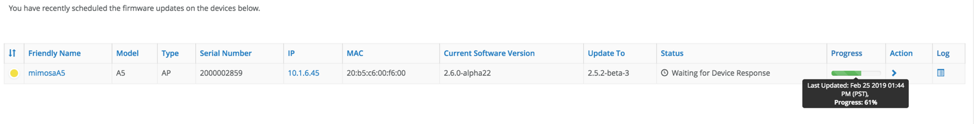
Once you’ve selected to upgrade a radio from the Mimosa Cloud, how do you know how far along the process is? Have you ever said, “is this radio ever going to upgrade or finish upgrading?” Now you get a pretty “now loading” bar that will show you how far along your firmware upgrade is.
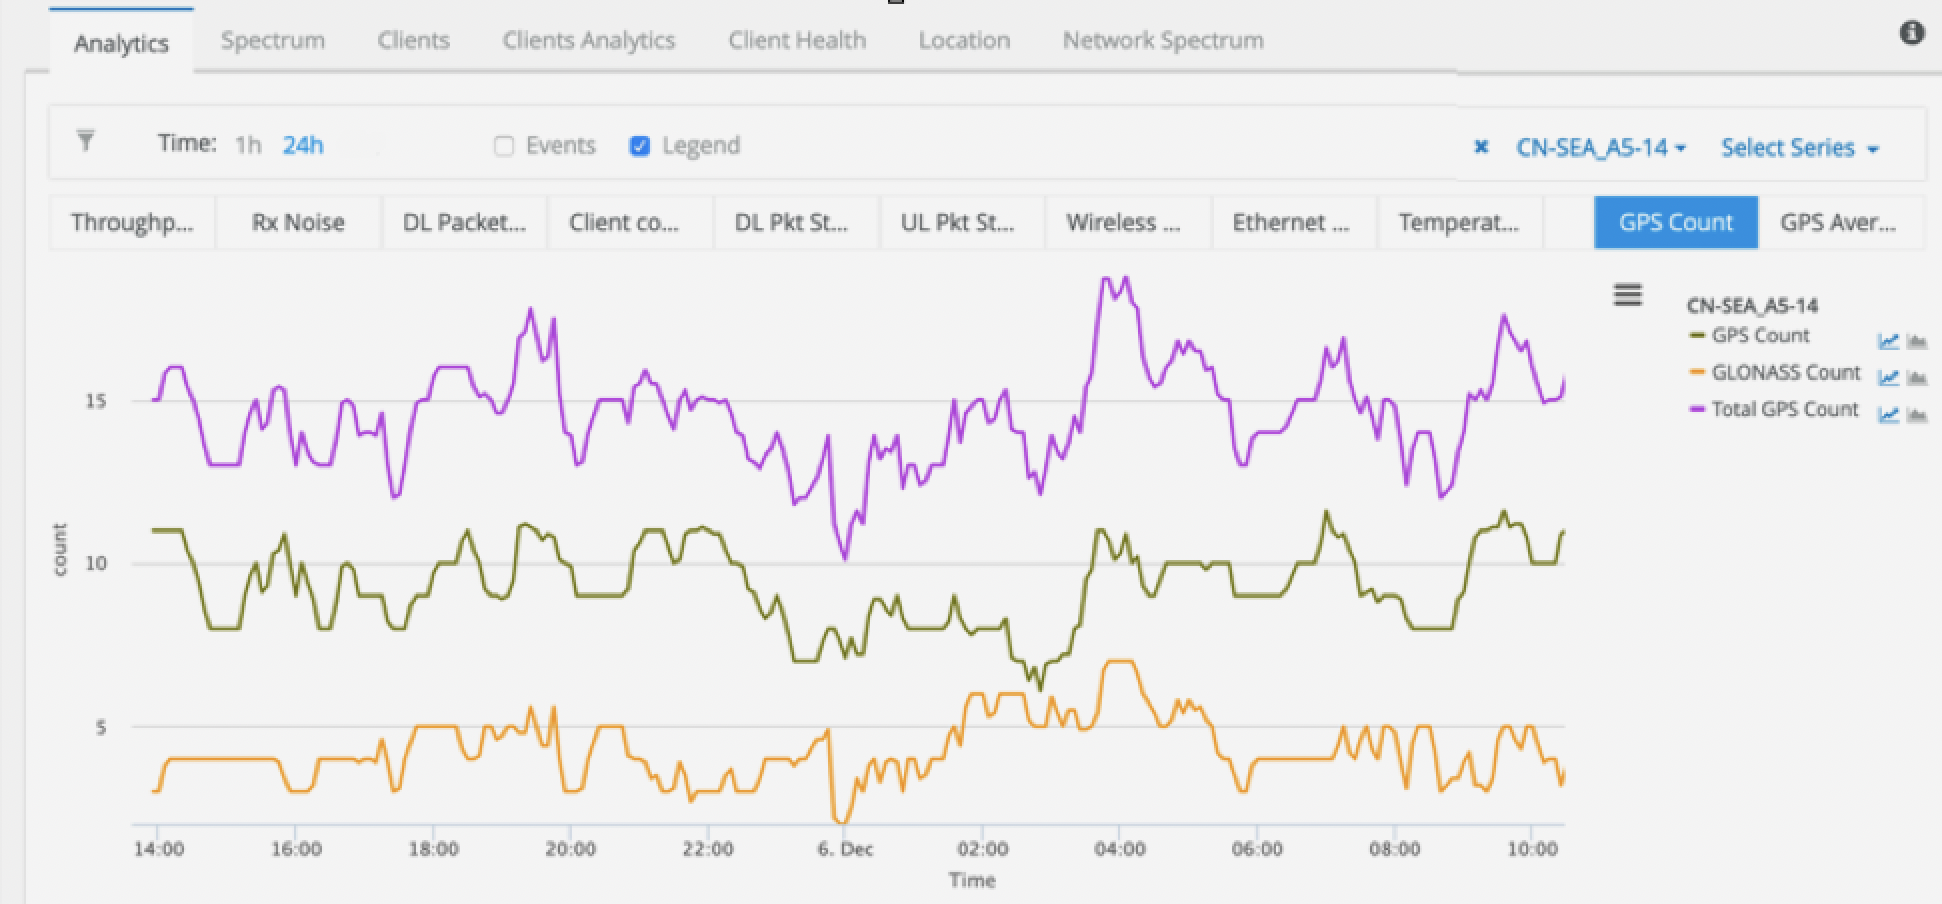
We wanted to give you more tools to troubleshoot issues with your A5 radios. Now you’ll be able to see the temperature of the Radio chip (BBIC) and the NPU on the A5 or A5c board. You’ll also be able to see GPS count and GPS Average SNR. This is perfect for folks that are trying to troubleshoot GPS issues. I’ve used these many times to diagnose external GPS interference on towers with many radios collocated in small areas.
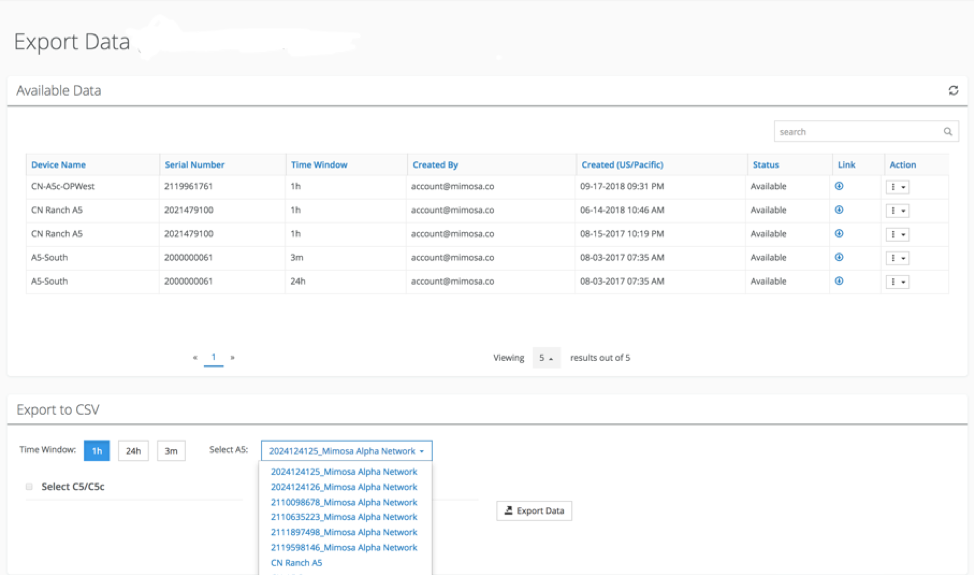
The Export Data option is there for folks to save radio data to a CSV spreadsheet. This is perfect for those that want to keep historical data on radio links. This could be used to input radio data into a third-party graphing system, if the Mimosa Cloud isn’t sufficient for your data and graphing needs.
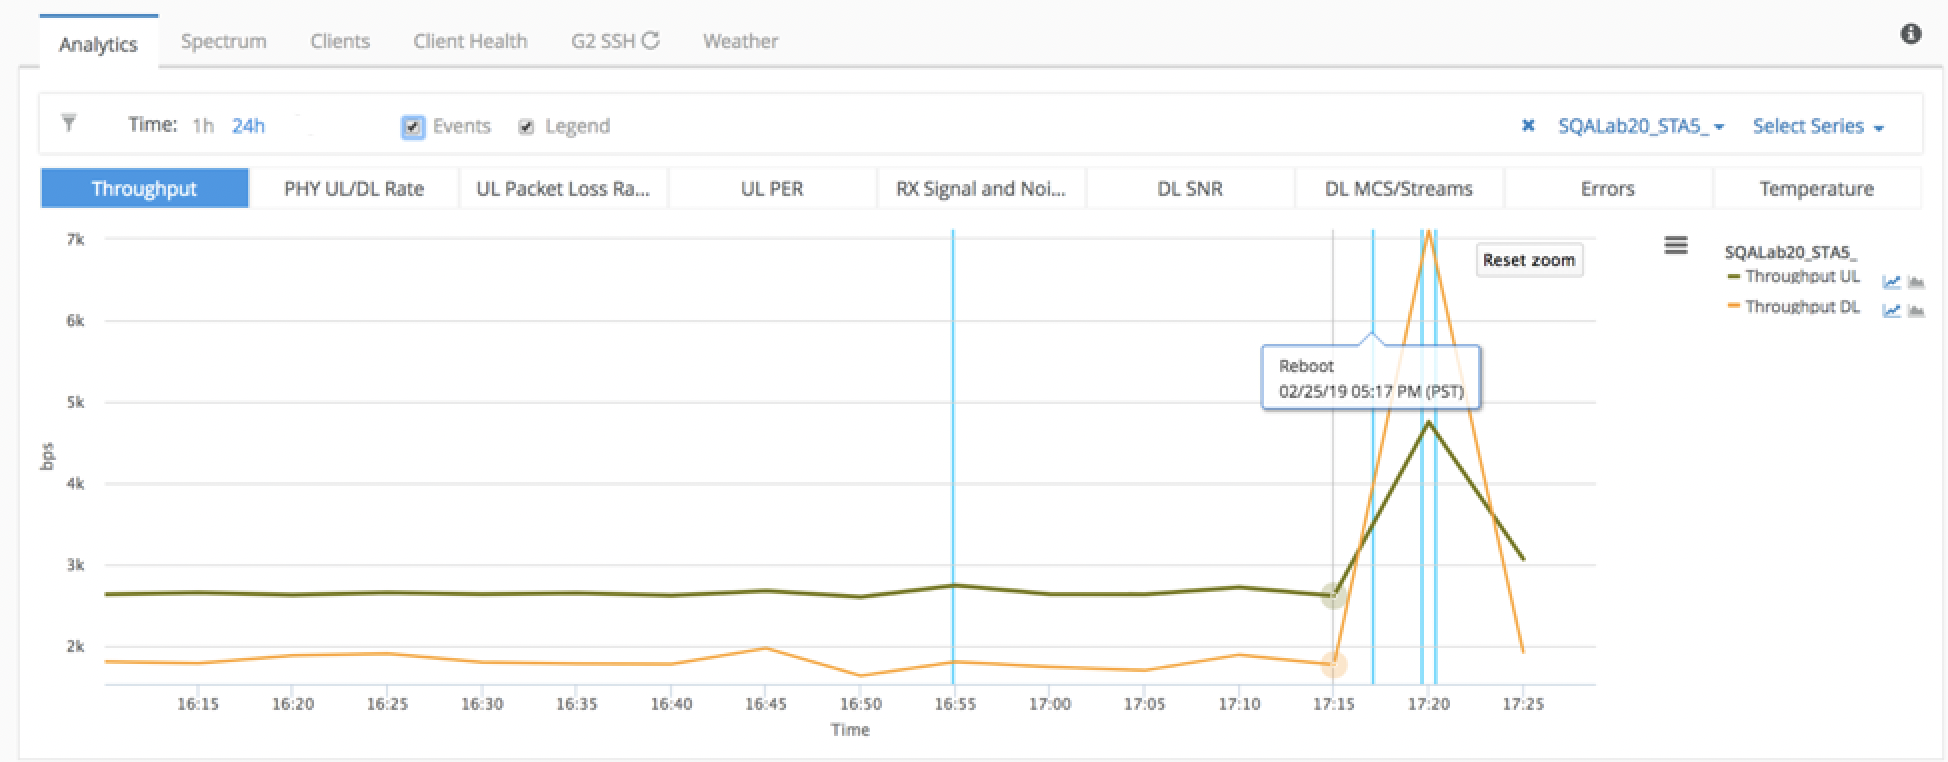
Lifecycle Events are very important to me and those in Mimosa Support. We wanted to pass on some of our most important troubleshooting information to you. Our goal is to make troubleshooting issues a much easier process for our customers. When enabling Events, you see blue lines on your graphs that represent channel changes, firmware upgrades, reboots, and link disconnections. This will hopefully help point you in the right direction when troubleshooting performance issues with your Mimosa equipment.
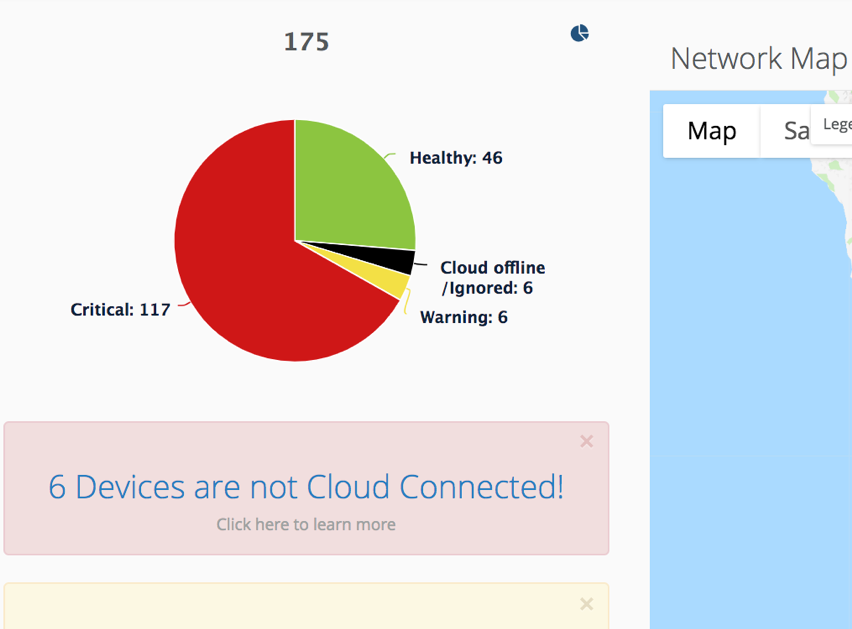
Previously you would only get a series of dots with numbers attached to them, on the Dashboard screen. Now you’ll see devices in your network sorted by Healthy, Warning, Critical, Cloud Disconnected, or Ignored. All of this will be displayed to you in a pie chart, so you can better see what percentage of your network might be having issues.
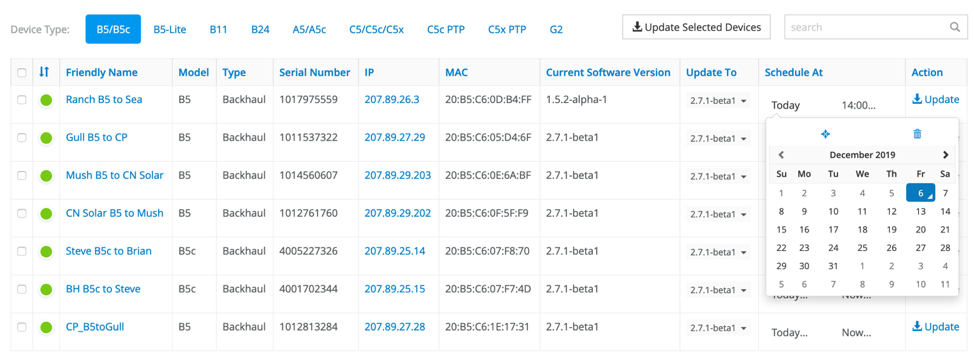
By popular demand, we now give you the option on when the Mimosa Cloud does upgrades for your radios! You’re able to choose which firmware to update to, what day, and at what time. This will remove any need for you to be awake at 3am to click a button for updates to begin. What are you waiting for? Try it out!
I hope that you find these features useful to you. They have been a huge help to me and the team here at Mimosa while managing our test network. We were going to wait a little longer to enable them for everyone, but I said: “What would be a better Christmas present than this?” Please let us know what you think and feel free to let us know what else you’d like to see in the Mimosa Cloud. One last thing: we have a ton of new things coming and I hope to be able to share all of these things soon!
Experience the perfect balance of performance and price with the new Mimosa C6x Lite Edition — built for today, ready for tomorrow.